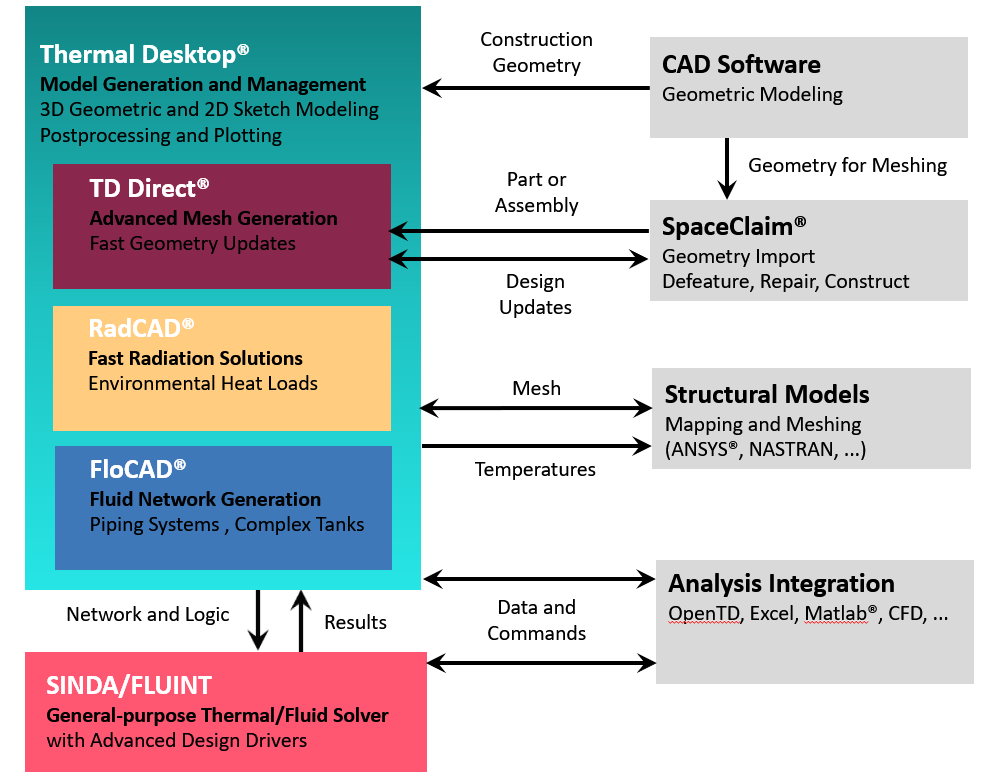
Graphical
User Interface for SINDA/FLUINT
Sinaps® is a graphical user interface for developing SINDA/FLUINT models and for viewing and reporting the results. Sinaps® provides a 2D sketch environment for thermal and flow modeling analysis allowing abstraction and simplification of complex systems.

Sinaps® allows the user to work with a SINDA/FLUINT model visually, reducing the learning curve and speeding the model building process. Because it is a complete pre and post-processor, it facilitates the reporting of results and the sharing of models between engineers. Thermal and fluid networks are sketched on the screen using pop-up menus and fill-in forms to quickly build and maintain complex models. Models can be validated, SINDA/FLUINT runs can be launched, and results can be displayed directly on your sketch via coloring and other postprocessing operations, all without leaving the Sinaps® environment.
The Case Manager in Sinaps® supports system modeling by streamlining the creation and management of multiple design cases for a master model. The Case Manager provides direct access to control parameters for convergence criteria along with various solution options, case-specific user-definable logic blocks, and post processing options.
Summary of Key Features
- Read in existing SINDA/FLUINT input files
- Import older SinapsPlus® XML files; requires installation of SinapsPlus export patch
- User-defined registers and expressions facilitate design changes and parametric analyses
- Case Manager: provides multi-case data management
- directly launches SINDA/FLUINT
- post-processing
- provides access to SINDA/FLUINT logic blocks
- Model Browser provides easy navigation for network object location and editing.
- Use advanced tools to organize and maintain large, complicated diagrams including:
- multiple copies of any node or lump ("clones")
- super-imposable drawing layers
- temporarily collapsed subnetworks ("collections")
- Thermophysical property database manager supports temperature-dependent properties
- Compatible with Thermal Desktop to allow database sharing
- Built in model checking tools
- Easy-to-use tool bars and object edit forms facilitate model building
- Color/shade nodes and lumps and thicken connections (conductors, ties, etc.) to visualize flow rates, temperatures, pressures, heat flows, pressure drops, vapor/gas qualities, etc.
- Post processing tools such as customizable meters and gauges
- Create X-Y plots and apply extensive customizations, including:
- legend, title, labels, colors
- compare results of multiple runs
- rescale axes and apply unit conversions
- add user lines generated by algebraic manipulations of other data series
- Print or export plots and network diagrams for report generation
- Use color-coded forms to distinguish common from advanced options
- Export a traditional input file to transfer to other SINDA/FLUINT users
- Convenient user comment fields provide model documentation

More
Information